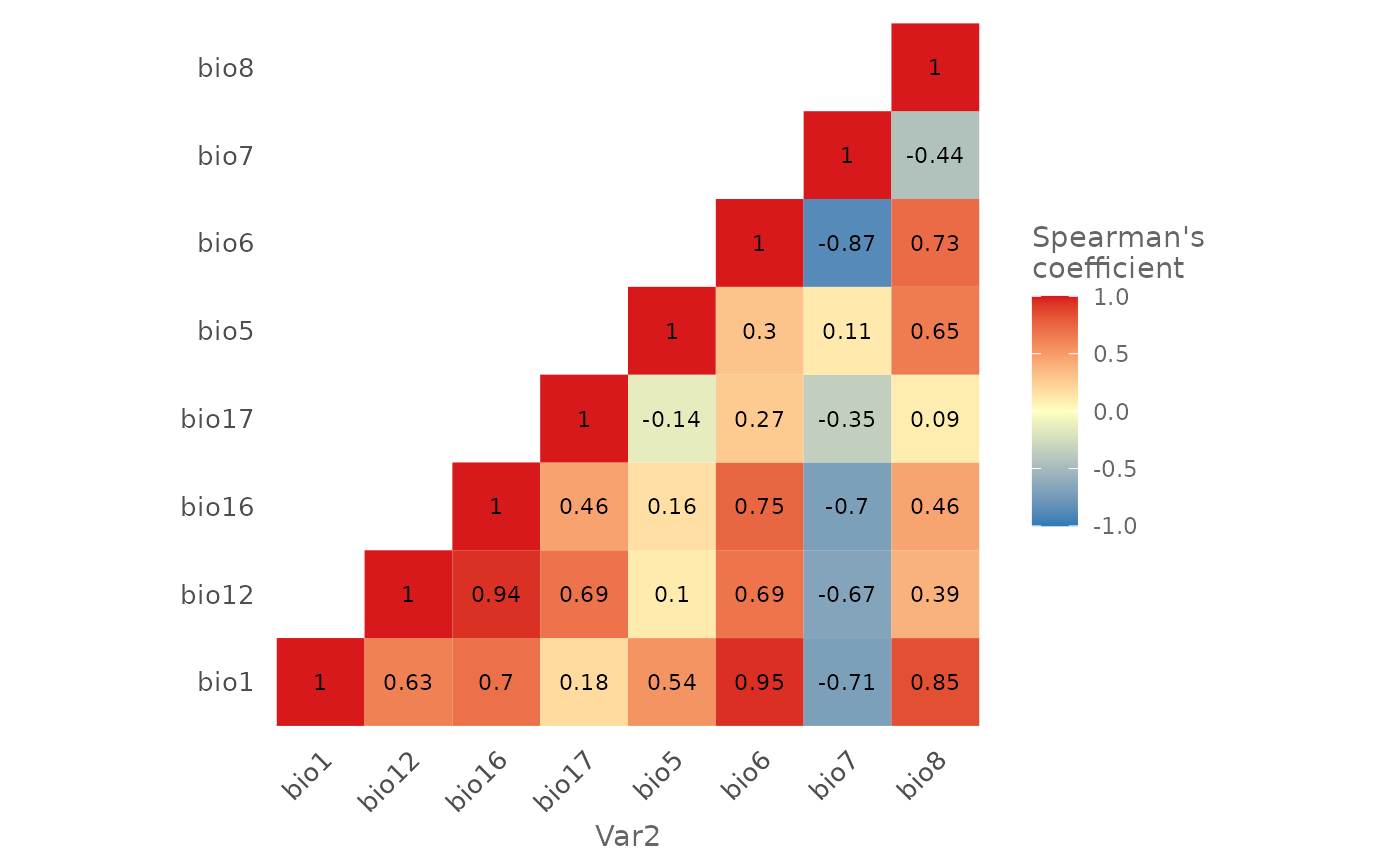
Plot a correlation matrix heat map with the value of the correlation coefficients according with the given method. If cor_th is passed then it prints only the coefficients that are higher or lower than the given threshold.
Arguments
- bg
SWD object used to compute the correlation matrix.
- method
character. The method used to compute the correlation matrix.
- cor_th
numeric. If provided it prints only the coefficients that are higher or lower than the given threshold.
- text_size
numeric, used to change the size of the text.
Value
A ggplot object.
Examples
# Acquire environmental variables
files <- list.files(path = file.path(system.file(package = "dismo"), "ex"),
                    pattern = "grd",
                    full.names = TRUE)

predictors <- terra::rast(files)

# Prepare background locations
bg_coords <- terra::spatSample(predictors,
                               size = 9000,
                               method = "random",
                               na.rm = TRUE,
                               xy = TRUE,
                               values = FALSE)

# Create SWD object
bg <- prepareSWD(species = "Virtual species",
                 a = bg_coords,
                 env = predictors,
                 categorical = "biome")
#> ℹ Extracting predictor information for absence/background locations
#> ✔ Extracting predictor information for absence/background locations [67ms]
#>

# Plot heat map
plotCor(bg,
        method = "spearman")


# Plot heat map showing only values higher than given threshold and change
# text size
plotCor(bg,
        method = "spearman",
        cor_th = 0.8,
        text_size = 4)
# Plot heat map showing only values higher than given threshold and change
# text size
plotCor(bg,
method = "spearman",
cor_th = 0.8,
text_size = 4)
