Skip to contents

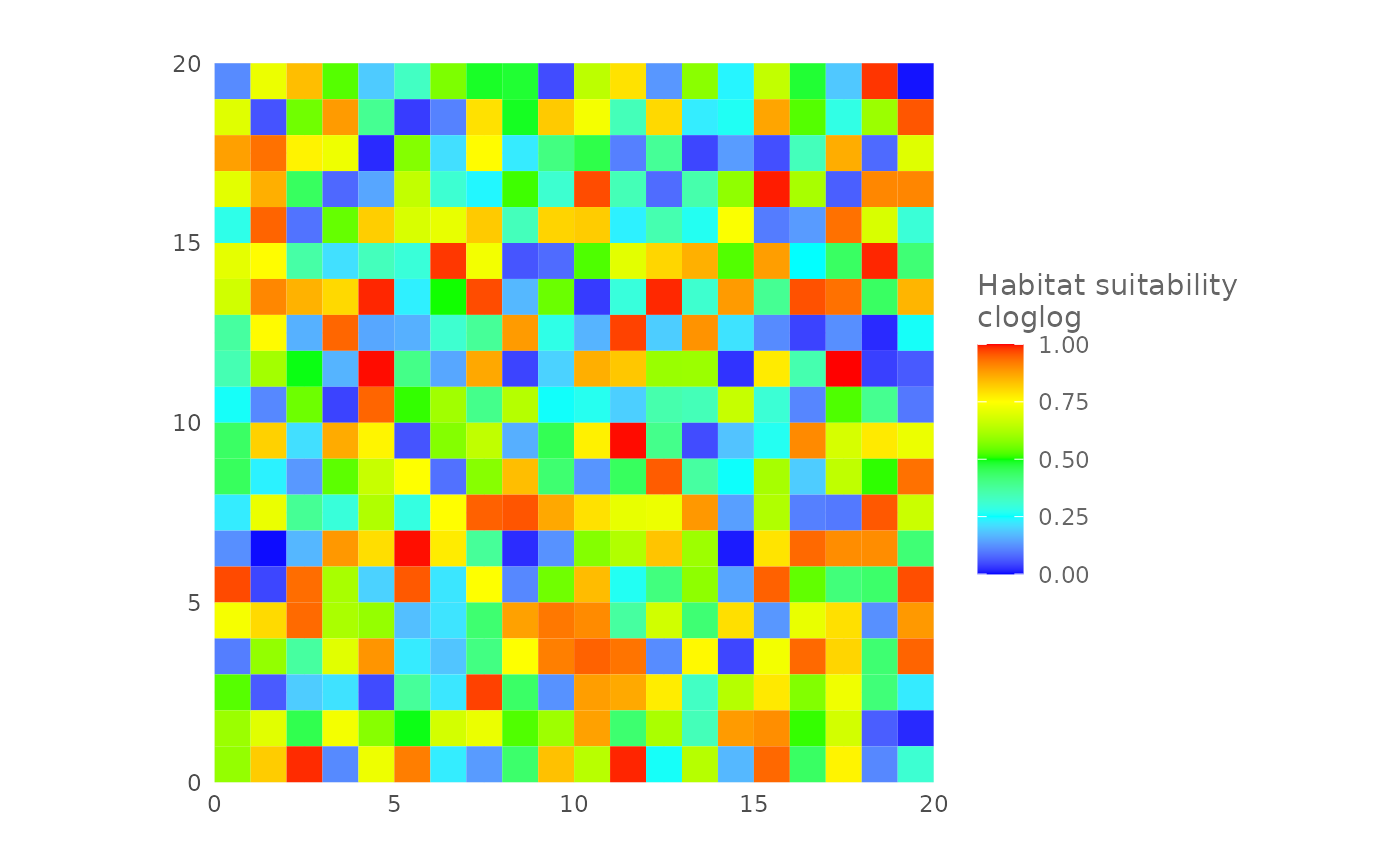
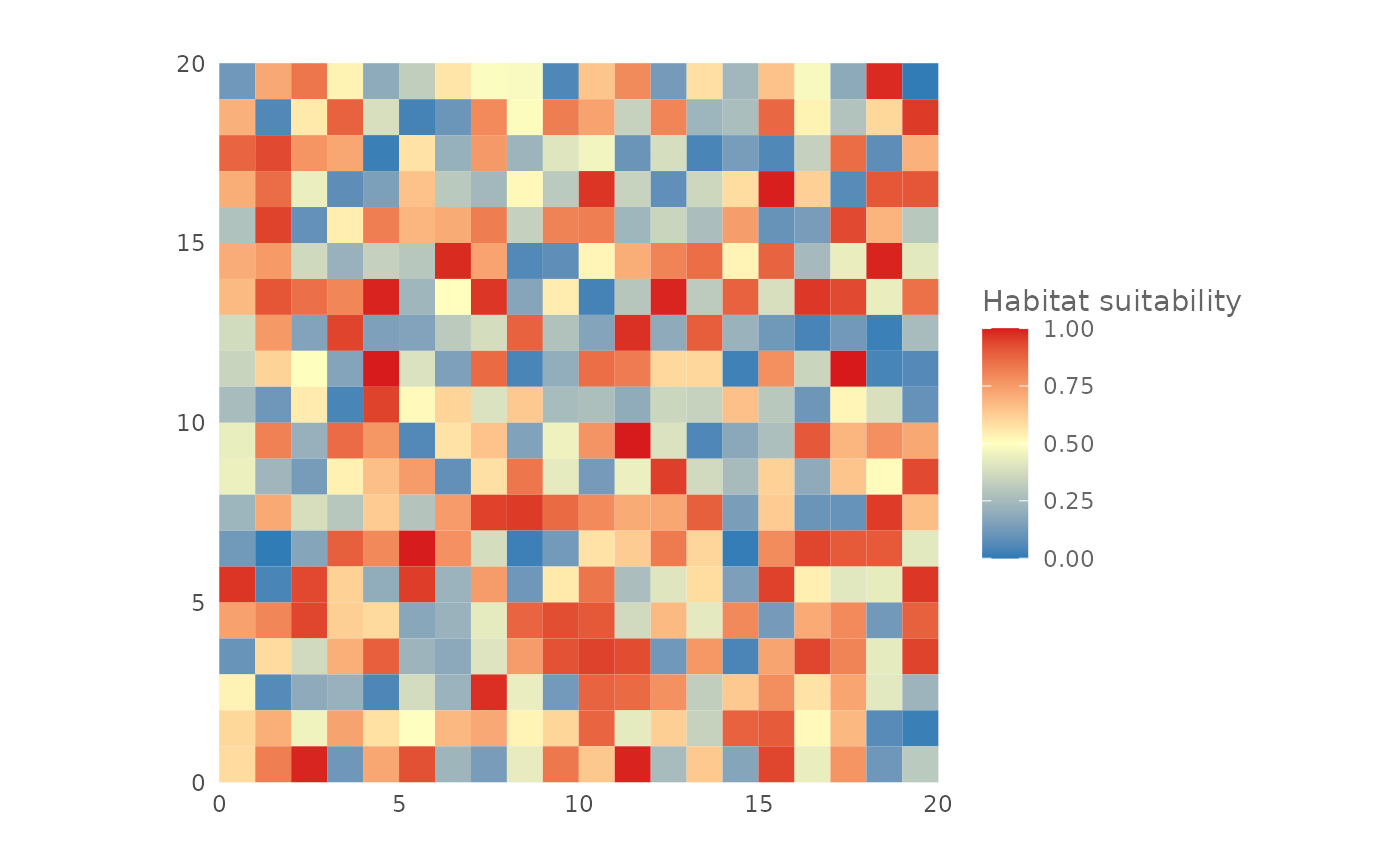
Plot Prediction output.

Usage

plotPred(map, lt = "", colorramp = NULL, hr = FALSE)

Arguments

map

rast object with the prediction.

lt

character. Legend title.

colorramp

vector. A custom colour ramp given as a vector of colours (see example), default is NULL and uses a blue/red colour ramp.

hr

logical. If TRUE produces an output with high resolution.

Value

A ggplot object.

See also

Author

Sergio Vignali

Examples

map <- terra::rast(matrix(runif(400, 0, 1),
                                    nrow = 20,
                                    ncol= 20))

plotPred(map,
         lt = "Habitat suitability \ncloglog")


# Custom colors
plotPred(map,
         lt = "Habitat suitability",
         colorramp = c("#2c7bb6", "#ffffbf", "#d7191c"))