Class used to save the results of one of the following functions: gridSearch, randomSearch or optimizeModel.
Plot an SDMtune object. Use the interactive argument to create an interactive chart.
Usage
# S4 method for class 'SDMtune'
show(object)

# S4 method for class 'SDMtune,missing'
plot(x, title = "", interactive = FALSE)Value
If interactive = FALSE the function returns a
ggplot object otherwise it returns an SDMtuneChart
object that contains the path of the temporary folder where the necessary
files to create the chart are saved. In both cases the objects are returned
as invisible.
Slots
resultsdata.frame. Results with the evaluation of the models.
modelslist. List of SDMmodel or SDMmodelCV objects.
Examples
# \donttest{
# Acquire environmental variables
files <- list.files(path = file.path(system.file(package = "dismo"), "ex"),
pattern = "grd", full.names = TRUE)
predictors <- terra::rast(files)
# Prepare presence and background locations
p_coords <- virtualSp$presence
bg_coords <- virtualSp$background
# Create SWD object
data <- prepareSWD(species = "Virtual species", p = p_coords, a = bg_coords,
env = predictors, categorical = "biome")
#> ℹ Extracting predictor information for presence locations
#> ✔ Extracting predictor information for presence locations [21ms]
#>
#> ℹ Extracting predictor information for absence/background locations
#> ✔ Extracting predictor information for absence/background locations [48ms]
#>
# Split presence locations in training (80%) and testing (20%) datasets
datasets <- trainValTest(data, test = 0.2, only_presence = TRUE)
train <- datasets[[1]]
test <- datasets[[2]]
# Train a model
model <- train(method = "Maxnet", data = train, fc = "l")
# Define the hyperparameters to test
h <- list(reg = 1:5, fc = c("lqp", "lqph"))
# Run the gridSearch function using as metric the AUC
output <- gridSearch(model, hypers = h, metric = "auc", test = test)
#> Grid Search ■■■■■■ 18% | ETA: 18s - 00:00:04
#> Grid Search ■■■■■■■■■■■■ 36% | ETA: 11s - 00:00:6.4
#> Grid Search ■■■■■■■■■■■■■■■■■ 55% | ETA: 7s - 00:00:8.7
#> Grid Search ■■■■■■■■■■■■■■■■■■■■■■■■■■■■ 91% | ETA: 1s - 00:00:12.5
#> Grid Search ■■■■■■■■■■■■■■■■■■■■■■■■■■■■■■■ 100% | ETA: 0s - 00:00:12.6
#>
output
#>
#> ── Object of class: <SDMtune> ──
#>
#> Method: Maxnet
#>
#> ── Tested hyperparameters
#> • fc: "lqp" and "lqph"
#> • reg: 1, 2, 3, 4, and 5
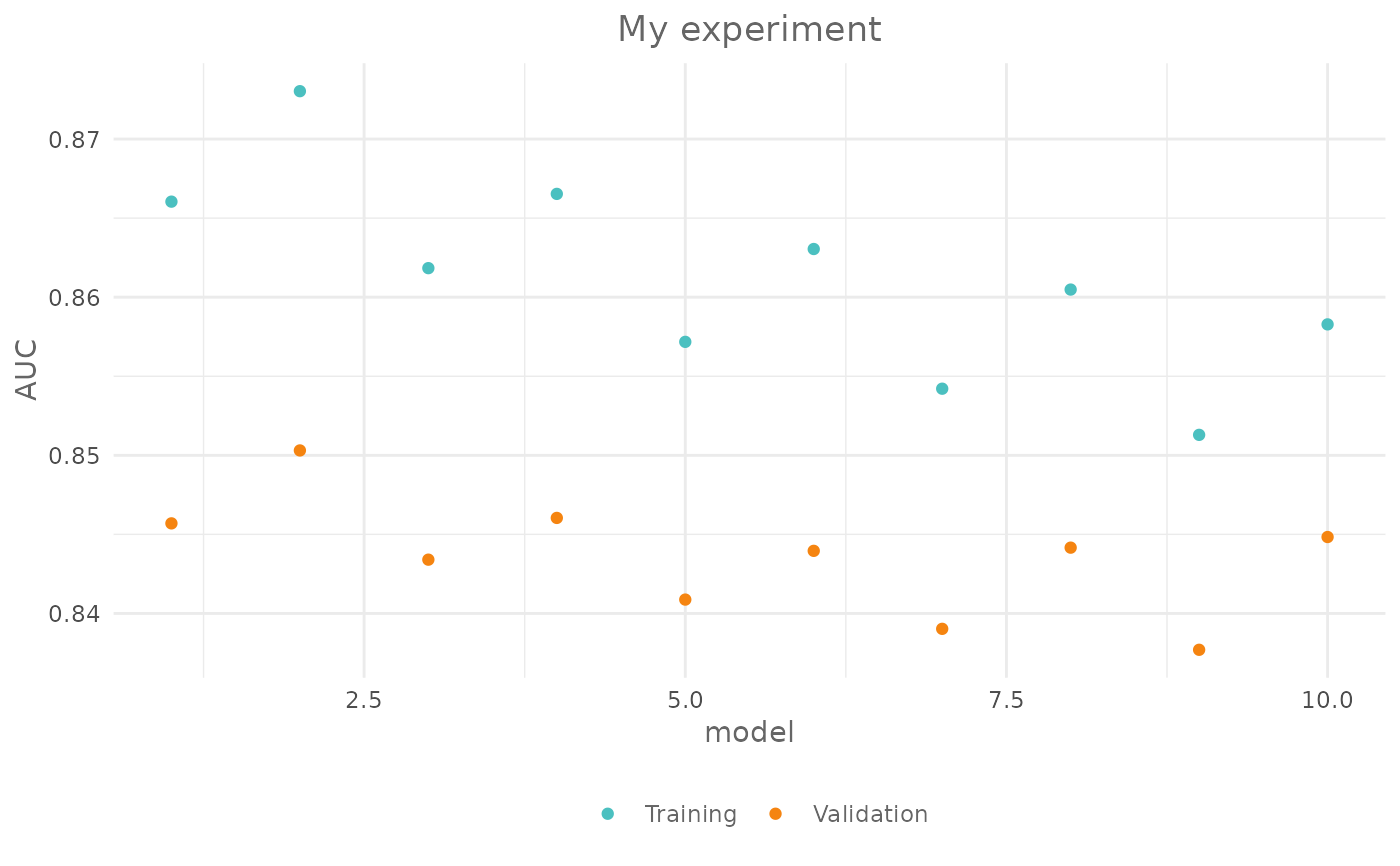
# Plot the output
plot(output, title = "My experiment")
 # Plot the interactive chart
p <- plot(output, title = "My experiment", interactive = TRUE)
# Print the temporary folder that stores the files used to create the chart
str(p)
#> 'SDMtuneChart' chr "/tmp/RtmpZYhaFo/SDMtune24ed29cfb8d4"
# }
# Plot the interactive chart
p <- plot(output, title = "My experiment", interactive = TRUE)
# Print the temporary folder that stores the files used to create the chart
str(p)
#> 'SDMtuneChart' chr "/tmp/RtmpZYhaFo/SDMtune24ed29cfb8d4"
# }