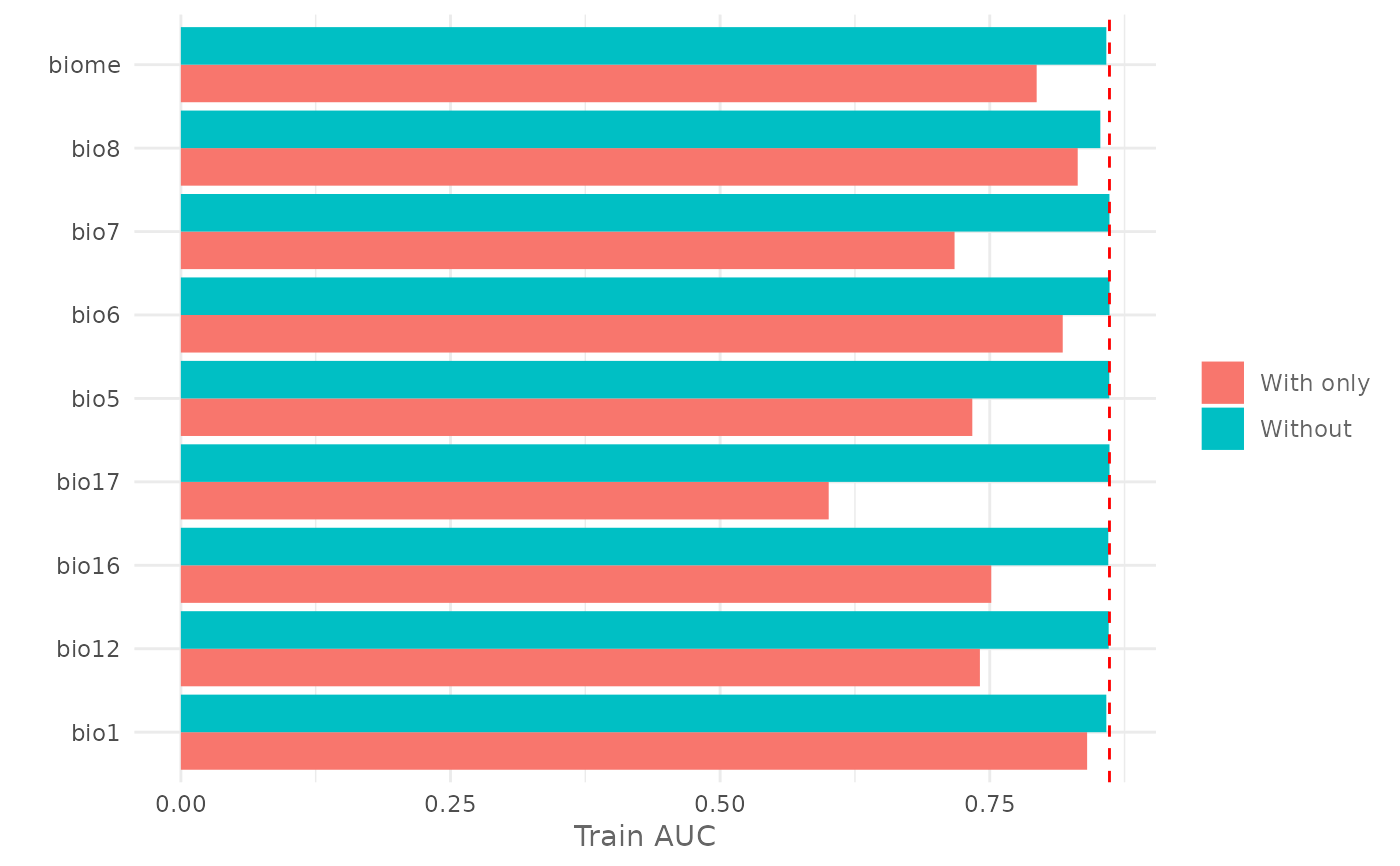
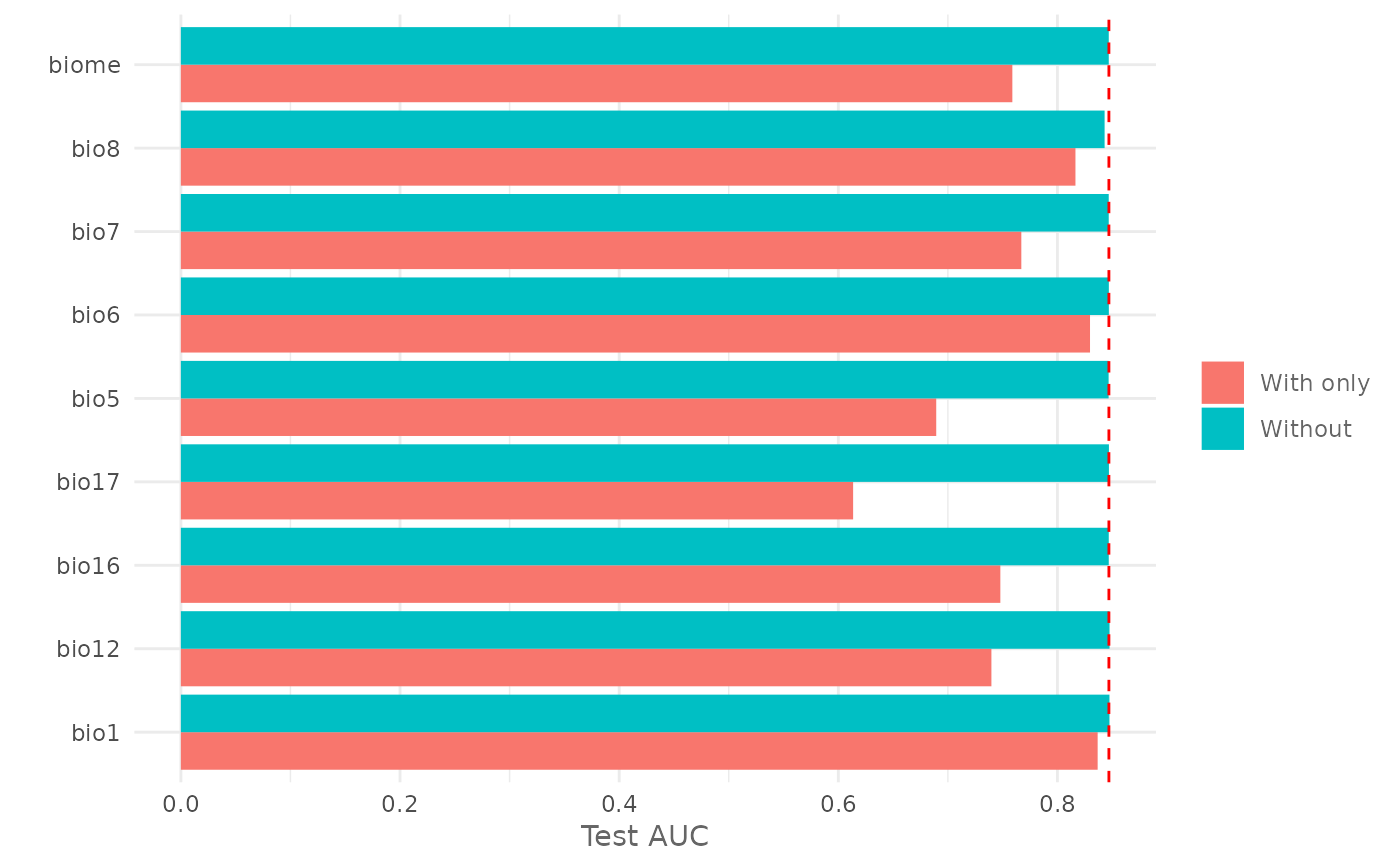
Plot the Jackknife Test for variable importance.
Usage
plotJk(jk, type = c("train", "test"), ref = NULL)Arguments
- jk
data.frame with the output of the doJk function.
- type
character, "train" or "test" to plot the result of the test on the train or testing dataset.
- ref
numeric. The value of the chosen metric for the model trained using all the variables. If provided it plots a vertical line showing the reference value.
Value
A ggplot object.
Examples
# Acquire environmental variables
files <- list.files(path = file.path(system.file(package = "dismo"), "ex"),
                    pattern = "grd",
                    full.names = TRUE)

predictors <- terra::rast(files)

# Prepare presence and background locations
p_coords <- virtualSp$presence
bg_coords <- virtualSp$background

# Create SWD object
data <- prepareSWD(species = "Virtual species",
                   p = p_coords,
                   a = bg_coords,
                   env = predictors,
                   categorical = "biome")
#> ℹ Extracting predictor information for presence locations
#> ✔ Extracting predictor information for presence locations [20ms]
#>
#> ℹ Extracting predictor information for absence/background locations
#> ✔ Extracting predictor information for absence/background locations [46ms]
#>

# Split presence locations in training (80%) and testing (20%) datasets
datasets <- trainValTest(data,
                         test = 0.2,
                         only_presence = TRUE)
train <- datasets[[1]]
test <- datasets[[2]]

# Train a model
model <- train(method = "Maxnet",
               data = train,
               fc = "lq")

# Execute the Jackknife test for all the environmental variables using the
# metric AUC
jk <- doJk(model,
           metric = "auc",
           test = test)
#> Jk Test  ■■■■■■■■■■■■■■■■■■■■■■■           72% | ETA:  1s - 00:00:2.8
#> Jk Test  ■■■■■■■■■■■■■■■■■■■■■■■■■■■■■■■  100% | ETA:  0s - 00:00:3.7
#>

# Plot Jackknife test result for training
plotJk(jk,
       type = "train",
       ref = auc(model))


#' # Plot Jackknife test result for testing
plotJk(jk,
       type = "test",
       ref = auc(model, test = test))

