Plot the ROC curve of the given model and print the AUC value.
Value
A ggplot object.
Examples
# Acquire environmental variables
files <- list.files(path = file.path(system.file(package = "dismo"), "ex"),
pattern = "grd",
full.names = TRUE)
predictors <- terra::rast(files)
# Prepare presence and background locations
p_coords <- virtualSp$presence
bg_coords <- virtualSp$background
# Create SWD object
data <- prepareSWD(species = "Virtual species",
p = p_coords,
a = bg_coords,
env = predictors,
categorical = "biome")
#> ℹ Extracting predictor information for presence locations
#> ✔ Extracting predictor information for presence locations [20ms]
#>
#> ℹ Extracting predictor information for absence/background locations
#> ✔ Extracting predictor information for absence/background locations [47ms]
#>
# Split presence locations in training (80%) and testing (20%) datasets
datasets <- trainValTest(data,
test = 0.2,
only_presence = TRUE)
train <- datasets[[1]]
test <- datasets[[2]]
# Train a model
model <- train(method = "Maxnet",
data = train,
fc = "l")
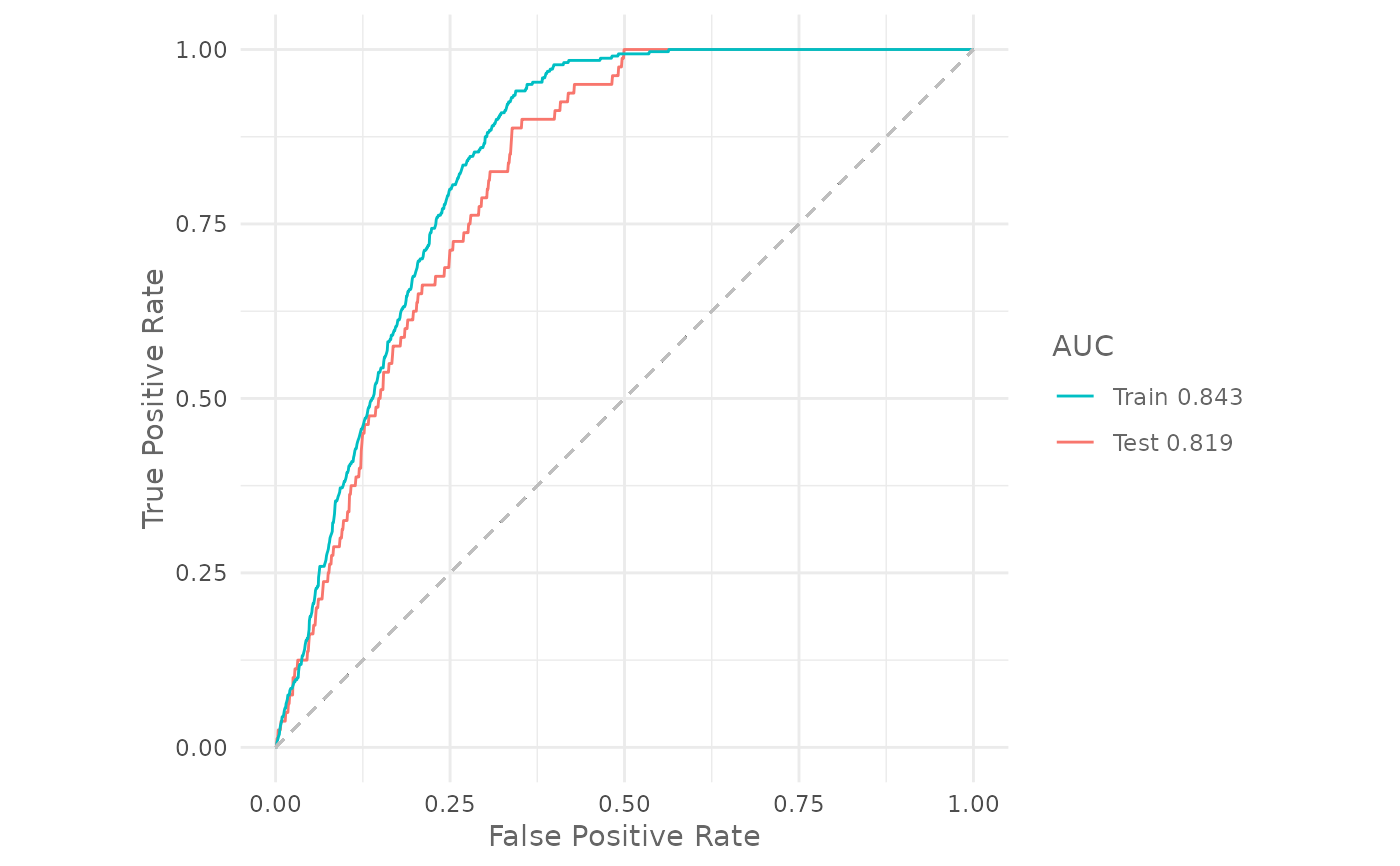
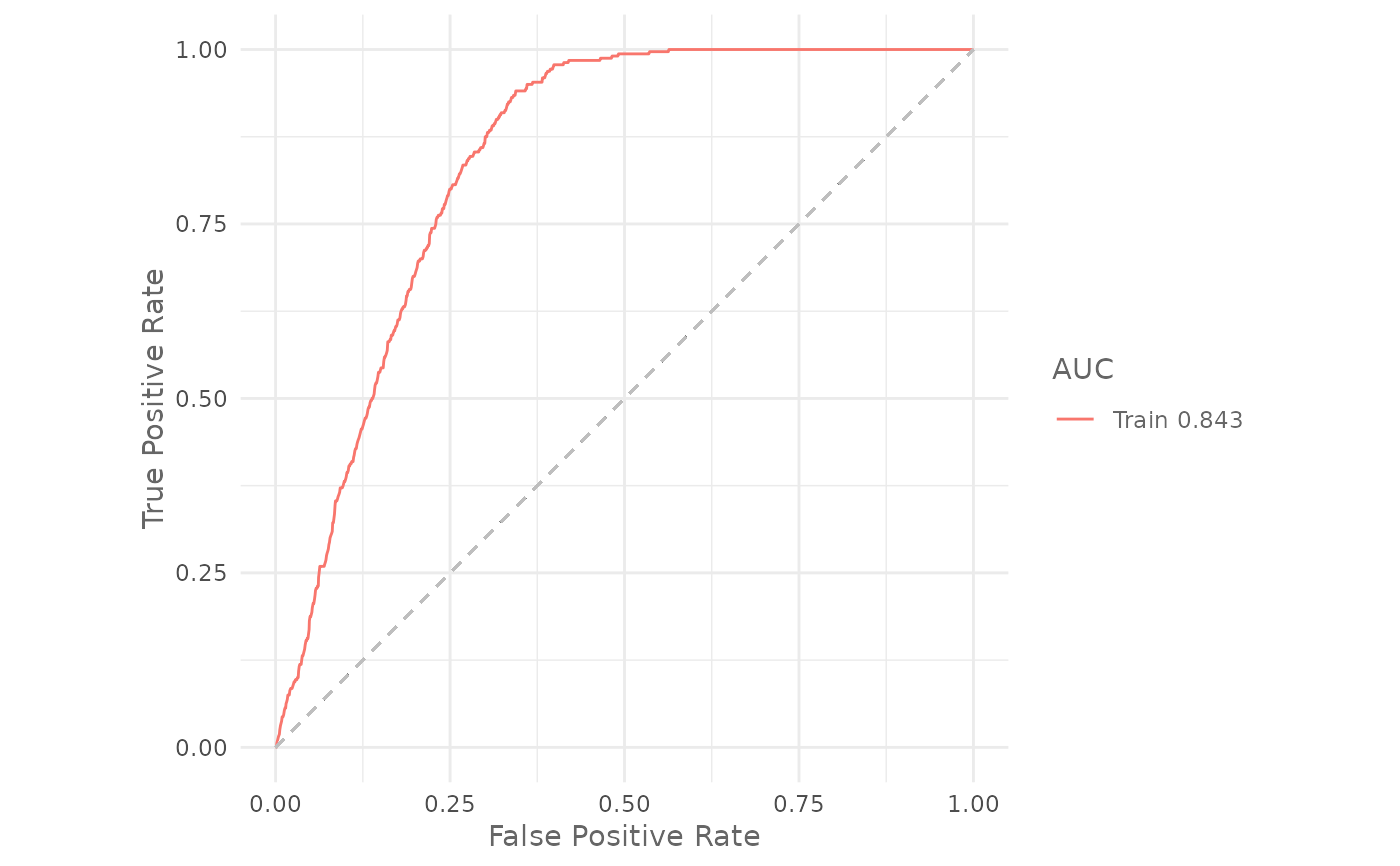
# Plot the training ROC curve
plotROC(model)
 # Plot the training and testing ROC curves
plotROC(model,
test = test)
# Plot the training and testing ROC curves
plotROC(model,
test = test)